Enabling Diagnostics in TPG Widget
To enable diagnostics for the TPG widget:
- Open ~/Library/Widgets/TPG.wdgt/TPG.js in a text editor
- Change the first line of code (past the documentation and revision historyFrom:
// global debug variable
var _debug = false;
To:
// global debug variable var _debug = true; - Save and quit
- On the dashboard, close the TPG widget and then add it again
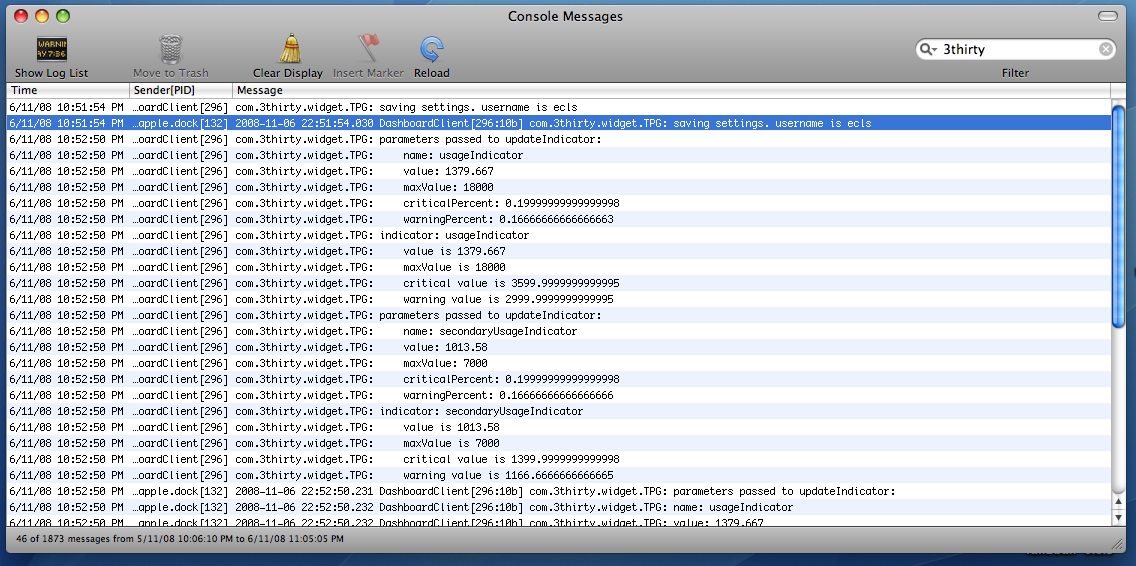
- Check /var/log/system.log (via the terminal, or the console app) for entries marked with 3thirty.
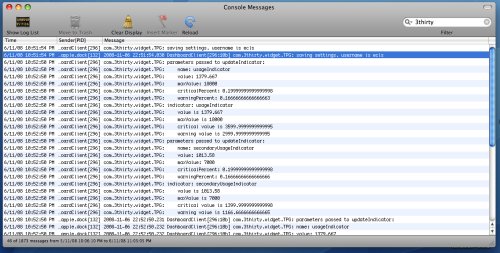
This will show the username that has been recorded, and the values that are used to calculate the usage meters
December 1st, 2008 at 8:41 am
Fantastic Widget – Works great except for a small cosmetic bug.
When the GB download goes into three figures (150GB plan here) the background becomes too small for the text and the gadget looses its neatness. Any chance of an update with a fix for this problem?
Cheers and thanks for writing such a handy little widget!
May 13th, 2009 at 11:57 pm
I can’t seem to be able to get this widget to work with a business account, are there any known issues there?
September 6th, 2009 at 11:56 pm
i can’t get this one to work in the office either. works at home fine.
i’ve got a Broadband Unlimited/Ultimate 1500/50GB at home, and at work we have the ADSL2+/50GB Premium. Both home and the office go through a modem/router.
Anyway, I really like this little widget – at home anyway!
Anyone any ideas what i might try to get it to work?